Introduction
Visual storytelling turns facts into feelings.
It makes complex ideas simple.
People remember images far longer than plain text.
When used well, visuals build trust.
They also increase shares and conversions.
This article teaches you how to plan and execute visual stories.
You will get step-by-step advice.
You will see real examples from brands and creators.
I will show metrics and testing techniques too.
Read this if you want visuals that persuade, not just decorate.
By the end you will have a repeatable process.
You will also get FAQs ready for featured snippets.
Let’s begin with the basics and move to advanced tactics.
What is visual storytelling?
Visual storytelling blends images, layout, and narrative.
It uses visual cues to guide emotion and action.
This method relies on composition, color, and pacing.
A single image can tell what a paragraph cannot.
Combining images with short text strengthens meaning.
Visuals can be photos, videos, illustrations, or data.
Each format has rules and strengths.
For example, a photo captures emotion fast.
An infographic clarifies data step-by-step.
A short video can demonstrate process and tone.
Purpose matters: are you informing, persuading, or entertaining?
Answer that and choose the right format.
Good visual storytelling aligns with brand voice.
It also meets audience expectations and platform norms.
When aligned, visuals shorten the path to trust and action.
Why visual storytelling improves engagement and conversions
People scan content quickly online.
Visuals stop the scroll.
They create an emotional hook in seconds.
Emotion drives memory and action.
Images reduce cognitive load.
They let audiences grasp ideas without effort.
That leads to higher time-on-page.
It also increases social shares and comments.
Marketers see better conversion rates with strong visuals.
Design and copy work together to guide decisions.
Visuals clarify product value.
They reduce returns by setting correct expectations.
For B2B, visuals explain complex workflows.
For e-commerce, they showcase product context.
Good visual stories also improve SEO indirectly.
Users stay longer. Bounce rates drop.
Search engines notice and may rank pages higher.
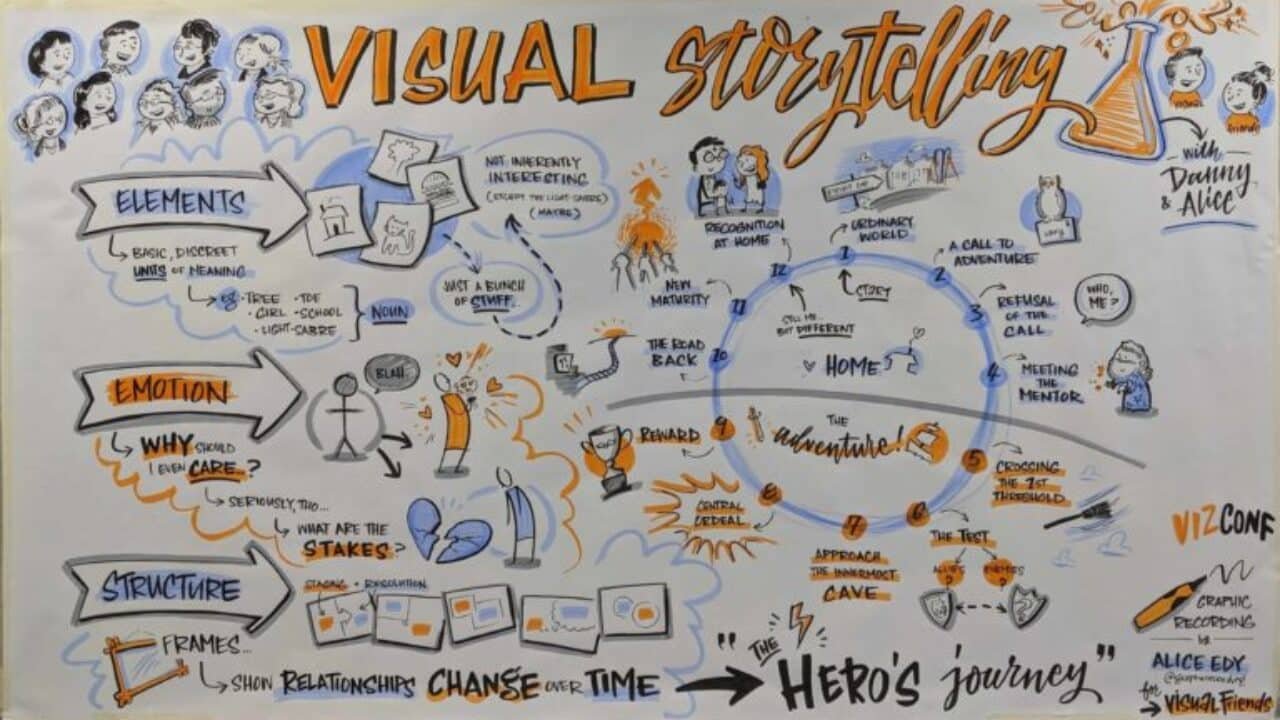
Core elements of a strong visual story
A strong visual story has seven key parts.
Use each deliberately to increase impact.
- Hook: The opening image or frame. Grab attention fast.
- Context: Quick details that orient the viewer.
- Character or subject: A person, product, or data point to follow.
- Conflict or tension: A problem to solve or insight to reveal.
- Resolution: The outcome or takeaway.
- Mood and tone: Set with color, lighting, and pacing.
- Call-to-action (CTA): What you want the viewer to do next.
Focus on hierarchy.
Lead the eye with size and contrast.
Use color to highlight the most important element.
Apply the rule of thirds for pleasing composition.
For data, use a clean chart with one clear message.
Avoid clutter. Each visual should say one thing.
Combine elements in short sequences to tell full stories.
That sequence can be slides, frames, or scroll-triggered visuals.
Channels, formats, and where each shines
Different channels need different visual approaches.
Match format to platform and audience.
- Instagram / TikTok: Short videos, carousels, bold visuals. Great for emotion and trends.
- LinkedIn: Data visuals, case-study snapshots, professional stories. Good for B2B.
- Blog / Website: Long-scrolling visuals, inline charts, embedded videos. Best for depth.
- Email: Single-image hero plus concise copy. Works well for conversion.
- Presentations: Narrative slides and clear charts. Ideal for pitches.
Each channel has size and length constraints.
Optimize resolution and aspect ratio.
Test thumbnails and first frames.
These decide whether the viewer clicks or scrolls past.
A consistent visual system helps brand recall across channels.
Process to craft a visual story
Follow these steps to create predictable results.
- Define the goal. What do you want the audience to feel or do?
- Know your audience. What visuals resonate with their tastes?
- Choose the format. Image, video, infographic, or interactive?
- Storyboard the sequence. Sketch frames and captions.
- Select assets. Photos, icons, charts, or footage. Prioritize authenticity.
- Design with hierarchy. Use size, contrast, and spacing.
- Write microcopy. Headline, subhead, CTA keep it short.
- Prototype and test. A/B test visuals and headlines.
- Measure outcomes. Track engagement and conversions.
- Iterate. Use data to refine tone and format.
| Step | Key Deliverable | Why it matters |
|---|---|---|
| 1 | Clear objective | Guides every choice |
| 4 | Storyboard | Prevents wasted revisions |
| 8 | Prototype | Finds weak links early |
| 9 | Metrics | Shows ROI |
This process makes visual storytelling repeatable.
It also reduces guesswork and cost.
Real-life examples and quick case studies
Example 1: A SaaS landing page.
They replaced long paragraphs with an explainer video.
Watch time rose by 40%. Conversions improved by 18%.
Why it worked: the video solved user doubts quickly.
The CTA matched the resolution of the story.
Example 2: An e-commerce brand.
They used lifestyle photos instead of isolated product shots.
Return rates dropped. Average order value increased.
Why it worked: customers pictured the product in real life.
This reduced mismatch between expectation and reality.
Example 3: A nonprofit campaign.
They combined a photo series with short captions.
Donations spiked after the emotional arc concluded.
Why it worked: the story created urgency and empathy.
These small case studies show the repeatable power of visuals.
What to track and why
Track metrics that tie to your goal.
Common KPIs include:
- Engagement: views, likes, comments, shares.
- Dwell time: how long users stay on the page.
- Click-through rate (CTR): from visual to CTA.
- Conversion rate: signups or purchases after viewing.
- Bounce rate: lower is better for visual pages.
Use A/B tests for thumbnails and first frames.
Run heatmaps to see where users look.
Survey users for qualitative feedback.
Combine behavioral data with business outcomes.
That proves visual storytelling ROI clearly.
Conclusion
Visual storytelling is a strategic skill.
It blends design, copy, and data.
It reduces friction and increases trust.
Start small with a single hero image or short video.
Use the step-by-step roadmap above.
Measure what matters and iterate fast.
Apply visuals consistently across channels.
That builds brand memory and action.
Ready to transform your content?
Pick one page or campaign and rework it with a visual story.
Test results for 30 days. See the difference.
FAQ — quick answers built for featured snippets
Q1: What is visual storytelling?
A: Visual storytelling uses images, video, and layout to convey a narrative. It aims to make information memorable and actionable.
Q2: Why use visual storytelling in marketing?
A: Because visuals capture attention fast. They increase engagement, reduce confusion, and often raise conversion rates.
Q3: Which visual format converts best?
A: It depends on the goal. Short videos convert well for demos. Lifestyle images work best for e-commerce. Infographics suit data-driven content.
Q4: How long should a visual story be?
A: Keep it as short as possible while delivering the full message. For social, 15–60 seconds is common. For explainer videos, 60–120 seconds often works.
Q5: How do you measure visual storytelling success?
A: Track engagement, dwell time, CTR, and conversion rate. Use A/B tests and heatmaps to refine visuals.
Q6: What are common mistakes to avoid?
A: Overloading visuals with text, using low-quality assets, and skipping testing. Also, avoid mismatched tone between image and copy.
Leave a Reply